Chi-Squared Test:
There are two different kinds of Chi-squared tests we could conduct. One is a goodness of fit if we wanted to test data against a particular model, and the second kind is a test of independence. Given the type of data that we have, what kind of test would you think is most appropriate? Why?
The answer the a test of independence. We want to see if the two factors median income and the math score on the PISA exam are independent of each other. The reason we use a chi-squared test is because it allows us to compare the observed values and expected values. We will rely on contingency tables of both types and test whether they are significantly different from one another.
We begin with our null and alternative hypothesis again. What do you think they would be?
Ho: A country's average math score from the PISA exam in 2012 is independent of its gross median household income in 2012.
Ha: A country's average math score from the PISA exam in 2012 is dependent of its gross median household income in 2012.
Let's use an alpha level of .05.
Our degrees of freedom are found using the formula: (r-1)(k-1)
r = number of rows
k = number of columns
Therefore, degrees of freedom = (2-1)(2-1) = 1
Contingency Table (2x2):
We will fill out a table with specific values considering these two factors. It will follow this format:
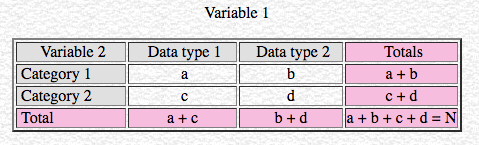
a+b represents the first row's total, c+d is the second row's total, a+c is column 1's total and b+d is column 2's total.
Then, in the bottom right corner, N represents the total of all observations. What is N for our research problem?
The way to create this table is slightly tricky. We want to find the number of countries there are in four different categories: Low income and low math score, low income and high math score, high income and low math score, and high income and high math score. How can we go about finding these numbers?
This is an exercise for you! Let's first think about what would happen if we found the average median income and split 25 countries above and below that value. Then, we can find the average math score and split the countries into low and high math scores. Next, we count how many countries in the low income group have a math score higher than the average. This would give us the number of countries in the low income and high math score group. We would follow similar steps to find the number of countries in the remaining three groups.
While this sounds confusing, we can break this into steps. First, find the average household income. This value will be $29,7
Average median household income: $29,761
Average math score: 474.5 points
How many countries are below the average median HH income? You will have some value x out of 50 countries. Then, how many countries out of x countries have an average math PISA score above 474.5 points? That is your value in the table for low median income and high math score. Follow these steps to find the remaining three groups. Each column and row should sum to 50 since we have 50 countries in our sample!
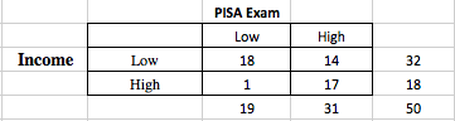
Remember, this table contains our observed values because these data points came directly from our sample. They are what actually occurred. Also, notice how we split our data into two different groups by the two factors we are interested in: median income and PISA score.
Here is the filled out contingency table below for observed values:
Then, in the bottom right corner, N represents the total of all observations. What is N for our research problem?
The way to create this table is slightly tricky. We want to find the number of countries there are in four different categories: Low income and low math score, low income and high math score, high income and low math score, and high income and high math score. How can we go about finding these numbers?
This is an exercise for you! Let's first think about what would happen if we found the average median income and split 25 countries above and below that value. Then, we can find the average math score and split the countries into low and high math scores. Next, we count how many countries in the low income group have a math score higher than the average. This would give us the number of countries in the low income and high math score group. We would follow similar steps to find the number of countries in the remaining three groups.
While this sounds confusing, we can break this into steps. First, find the average household income. This value will be $29,7
Average median household income: $29,761
Average math score: 474.5 points
How many countries are below the average median HH income? You will have some value x out of 50 countries. Then, how many countries out of x countries have an average math PISA score above 474.5 points? That is your value in the table for low median income and high math score. Follow these steps to find the remaining three groups. Each column and row should sum to 50 since we have 50 countries in our sample!
Remember, this table contains our observed values because these data points came directly from our sample. They are what actually occurred. Also, notice how we split our data into two different groups by the two factors we are interested in: median income and PISA score.
Here is the filled out contingency table below for observed values:
Now, let's look at the formula below. It will give us our chi-squared test statistic.
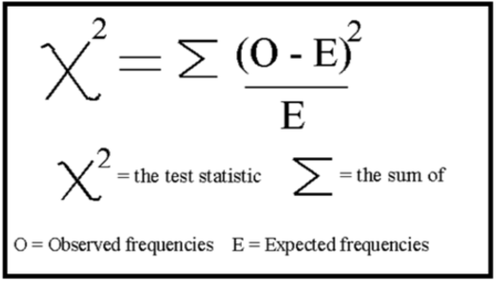
This gives us our chi squared test statistic, and in return we can find the p-value. From there, we will compare our p-value to the alpha level we set from the beginning. The alpha level is our significance value. This will tell us if the statistic we retrieved from our data is significant enough to reject the Ho. From there, we can then conclude whether or not there is an association between math scores and median income!
The next tricky part is determining the expected values. To do this, we rely on the contingency table previously given.
Formula for the expected value:
Expected Value = [ (Row Total) x (Column Total) ] / (Overall Total)
Take about ten minutes and fill out the expected values!
*Answers:
Low Income, Low PISA score: 32*19 / 50 = 12.16
Low Income, High PISA score: 31*31 / 50 = 19.84
High Income, Low PISA score: 19*18 / 50 = 6.84
High Income, High PISA score: 31*18 / 50 = 11.16
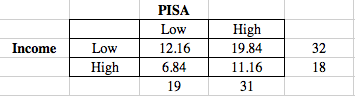
The table of our expected values is below.
The next tricky part is determining the expected values. To do this, we rely on the contingency table previously given.
Formula for the expected value:
Expected Value = [ (Row Total) x (Column Total) ] / (Overall Total)
Take about ten minutes and fill out the expected values!
*Answers:
Low Income, Low PISA score: 32*19 / 50 = 12.16
Low Income, High PISA score: 31*31 / 50 = 19.84
High Income, Low PISA score: 19*18 / 50 = 6.84
High Income, High PISA score: 31*18 / 50 = 11.16
The table of our expected values is below.
What we need to do now is follow the formula for our chi-squared statistic and find the square of the difference between the observed and expected value. We sum this and divide by our expected value. Luckily, we can use software to perform the chi-squared test for us so it is much faster!
To perform our chi-squared test, we will be using Fathom. This software is similarly designed to Tinkerplots which will make it more user friendly!
Note: There are ways to compute statistical inference testing by hand. However, today there are many different kinds of software that allow us to simply type in our data, and it will give us the immediate conclusion. While this is time efficient and very handy, it's still very important that we understand the number crunching happening behind the scenes. Otherwise, it will be very difficult to conclude correctly what these tests are telling us about our data!
Fathom is downloadable from online. There is a free 2-week trial, so don't worry about having to pay money.
Once you open up a new document from Fathom, click on the "test" button on the top. The icon is a picture of a scale. Drag the scale onto the white space, and in the top right corner of this new window, click on "empty test" and select the appropriate test we are doing.
Next, Fathom wants us to type in the data by hand. Luckily, we do not need to import a text file this time, so it makes our lives a little bit easier. We want to type in the correct Row and Column Attributes so we understand what values go where. Looking at the contingency tables we made early, what would the appropriate titles be?
Go ahead and fill out the table with the observed values. The expected values will be calculated by the software and will appear in parenthesis. Under the table where the written words are is where we name the Row and Columns. We also should put in the number of row and columns so that our table is appropriate for us. After, the chi-squared test statistic is automatically calculated as well as the p-value and degrees of freedom.
The software also tells us what our alternative hypothesis is.
You should have been able to create the table and have the same output as below.
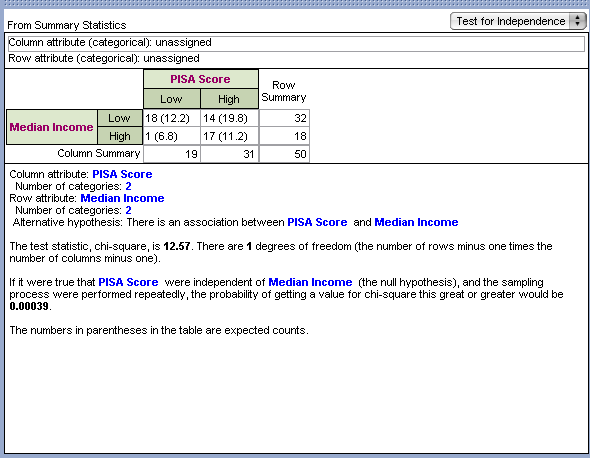
Is your output similar as above? What p-value did we get?
If we compare our p-value to our significance level, what conclusion can we make? (This will be further discussed in the conclusion)
Our p-value is .000039. This is much smaller than .05. Thus, it is safe to reject our null hypothesis. This means that we can conclude that there is an association between the math PISA score and median household income for countries in 2012.
What would happen if we changed the values of our observed contingency table? Click here to investigate!
Here, we can fill out the specific values of our observed table. For both category 1 and 2, the titles of our table are Low and High. Then, enter the correct values into the table and look at the graph represented.
The blue bars represent the observed values, and the red bars represent the expected. We can see the discrepancy between these values. We can also see what conclusion can be drawn from this chi-squared test.
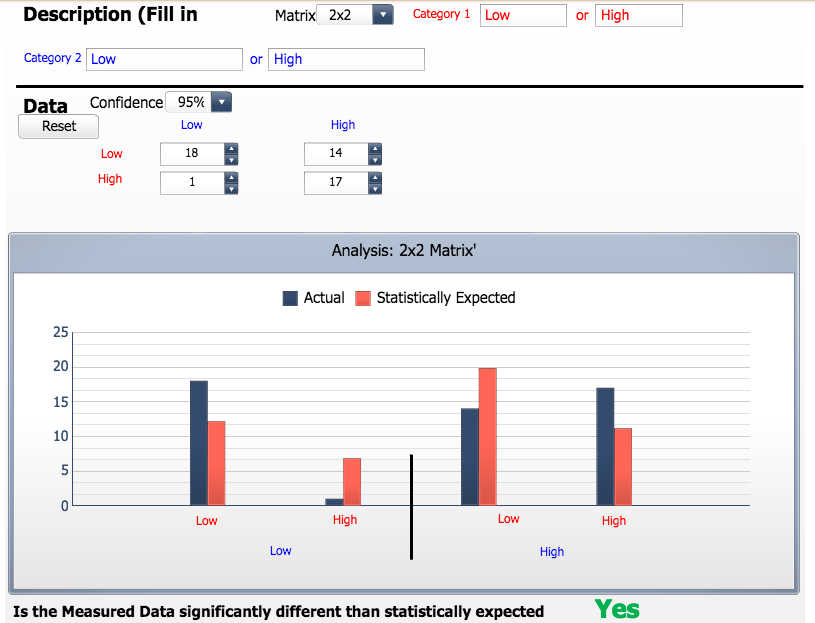
Since the measured data is significantly better than expected we can reject our null hypothesis. This is telling us that our chi-squared statistic will give us a p-value much smaller than our significant level chosen (alpha). Thus, we can conclude that a country's average math score from the PISA exam in 2012 is dependent of its gross median household income in 2012.
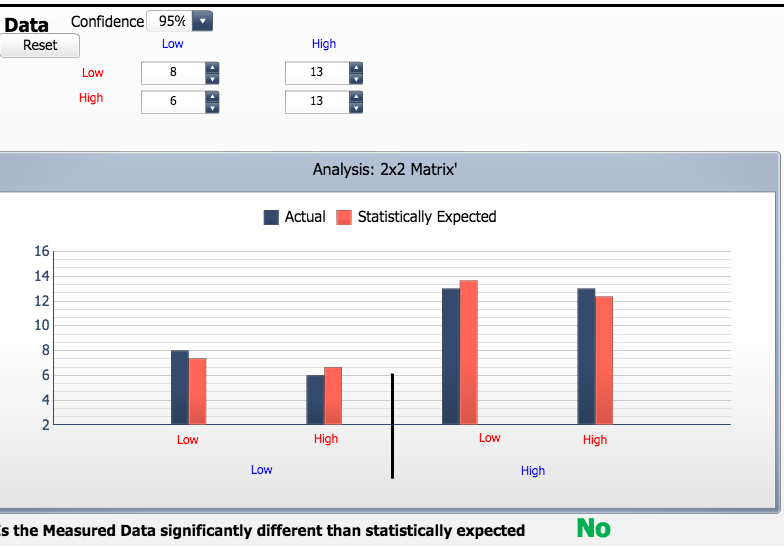
Take some time and change the values in the observed table. How different would our points have to be to be able to conclude that there is not a relationship between our two factors?
Here's one example. Notice that the values in our table are closer together. There is not as much difference between them. What could we conclude about our chi-squared statistic and p-value then?
The observed and expected values are more similar in the data and graphical display below. This means that the data is not significantly different from what we would expect.
We're almost done with our investigations of median household income and math scores from the PISA exam. Click here to look at the conclusion!
