Excel Activity
Now that we have some understanding of what each piece of the FTC is telling us, we can begin exploring the idea of delta x, or subintervals.
Why is it important to break up x into subintervals? How does this help us determine how far the ladybug travels?
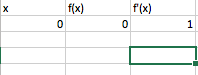
Our first investigation into the FTC will involve an excel activity. Open excel on your computer and set up a table as such (right image).
You should create columns for x, f(x), and f'(x). Since we said a = 0 seconds, put a 0 under x. Let's let f(x) = x. Thus, f(0) = 0. Click on the first picture in the gallery to see the fully filled out excel sheet.
The x column contains the specific times where we calculate the ladybug's distance. This is determined by what our delta x or subintervals are. We will want to divide the total time interval into equal divisions. For our first example, we will chose a=0 and b=1. Thus, we can choose a delta x that will create even subintervals between 0 to 1. For the first example, let delta x=.05.
Let's let f'(x) = 1 that way it stays constant over time. This means our ladybug is crawling at a constant rate throughout the time interval. So, our next x value will be .05. f(.05) = .05, and f'(x) is still 1 (it's constant).
Go ahead and fill out the rest of the excel table. Refer to the images in the gallery to check your answers.
Once you are finished, we are going to sum up f(x). By doing this, what can we determine from this? What does this tell us about the ladybug's placement?
Why is it important to break up x into subintervals? How does this help us determine how far the ladybug travels?
Our first investigation into the FTC will involve an excel activity. Open excel on your computer and set up a table as such (right image).
You should create columns for x, f(x), and f'(x). Since we said a = 0 seconds, put a 0 under x. Let's let f(x) = x. Thus, f(0) = 0. Click on the first picture in the gallery to see the fully filled out excel sheet.
The x column contains the specific times where we calculate the ladybug's distance. This is determined by what our delta x or subintervals are. We will want to divide the total time interval into equal divisions. For our first example, we will chose a=0 and b=1. Thus, we can choose a delta x that will create even subintervals between 0 to 1. For the first example, let delta x=.05.
Let's let f'(x) = 1 that way it stays constant over time. This means our ladybug is crawling at a constant rate throughout the time interval. So, our next x value will be .05. f(.05) = .05, and f'(x) is still 1 (it's constant).
Go ahead and fill out the rest of the excel table. Refer to the images in the gallery to check your answers.
Once you are finished, we are going to sum up f(x). By doing this, what can we determine from this? What does this tell us about the ladybug's placement?
Looking at the second photo, we see that after we sum the entire distance covered, we get 1.05. Is this what we should expect? If not, what should the value actually be?
While 1.05 is not necessarily wrong, there is a slight error since the total should be 1. Now, let's try doing this again with delta x = .01.
Do the activity once more with the new delta x and determine what the new error is. How does this compare to your error when delta x = .05. Why are they different?
Refer to the next two imagines in the gallery. Now, we see that the total distance traveled from time a to time b is 1.01, so the error is smaller. Why is this? When we make delta x smaller, we are creating more even subintervals and accumulating smaller amounts of distance at a time between a and b. This somehow allows the error in our calculation to become closer to 0. Why do you think this is? Click on the Riemann sums tab to find out!


