Global Outlook
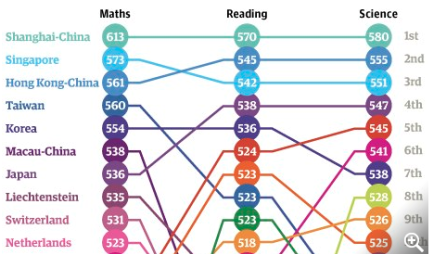
Now that we better understand what the PISA test tells us, let's look at the results from the 2012 exam. We will only be concerned with the math results. From the image to the left, we see that Shanghai-China, Singapore, and Hong Kong-China were the top three scoring countries.
Let's learn a little about median income! How does this differ from per capita? Which one is a better indicator of how well off a country is?
Per Capita Income:
This is calculated by adding the total income that a nation, state or country makes, and dividing it by the total number of people in that geographic area. While this information is readily available for almost every country on Earth, it is not a good representation of a country's economic well-being. Why is this so? Imagine that 10% of the population is extremely rich and the rest of the 90% of the population is very poor. That 10% can influence the per capita income and raise the value higher even though the majority is poor. Thus, extreme values are not taken into consideration. In fact, if we removed such outlier, the per capita income would drastically change. Thus, our image of how well off a country is can be skewed, so per capita income is not the most reliable way to know the average person's income.
Median Income:
Median income gives us a specific income value. It tells us that 50% of households made less than this income and 50% made more. Thus, it splits the number of observations in half. As discussed in the Statistics crash course page, we know that the median is a robust measure of data's center. Thus, it is a more accurate representation of the group of interest. Median income is more accurate than per capita income especially when looking at a small group of individuals (think about the CLT).
Research Question:
Is there enough evidence to suggest a relationship between median household income and the test results from the math section of the PISA exam in 2012?
In order to find the answer, we will split the countries who took the PISA exam in 2012 into two groups, group A and group B. Group A will contain 25 countries that have higher median incomes. Group B will contain the 25 countries with lower median incomes. We can find this by sorting our list of countries by the median income and creating a split in the middle. This means we are relying on our median to create our two groups!
To continue with our statistical investigation, we will use various statistical testing methods to see if there is significant evidence to suggest that there is a relationship between median household income and the PISA math results.
Background considerations:
Sometimes statistics can be wordy and confusing, so let's reword this. We will take the countries who took the PISA exam in 2012 and split them into two groups. Group A will contain the countries who have a higher median income than Group B. We want to convey through statistical reasoning that the PISA results from Group A will be higher than Group B. Rather, we are stating that students who come from wealthier areas do better on these test and receive a better education.
In order to do this, we must consider multiple factors.
To begin, let's look at the list of countries we want to analyze. There were a total of 59 countries, but for this investigation we will be taking a sample of 50 countries and splitting them into two groups, A and B, according to their gross median income.
Countries in Group A- High Gross Median Household Income:
Luxembourg
Norway
Sweden
Australia
Denmark
United States
Canada
Netherlands
New Zealand
Hong Kong- China
Austria
Finland
Japan
Germany
Singapore
United Kingdom
France
Isreal
Belgium
Qatar
Slovenia
Ireland
Czech Republic
Spain
Italy
Countries in Group B- Low Gross Median Household Income:
Greece
Slovak Republic
Croatia
Portugal
Poland
Argentina
Estonia
Hungary
Lithuania
Russian Federation
Mexico
Republic of Montenegro
Malaysia
Latvia
Turkey
Costa Rice
Republic of Serbia
Bulgaria
Chile
Uruguay
Brazil
Kazakhstan
Romania
Albania
Thailand
Their specific test scores with the standard error will be given later.
To learn more about bivariate data, click here.
